Metrics Tab
The Acumen Fuse analysis engine uses libraries of metrics to run project analytics. The metric editor provides a means of simplifying the development of metrics by reducing the amount of times a metric formula needs to be manually written.
What is a Metric and How Does it Work?
A metric is a standard or measure for use in determining how well a project is planned and executed.
- Use primary formulas to calculate counts as part of an analysis.
- Use secondary formulas to calculate ratios.
- Use Tripwire thresholds to flag and filter activities that exceed given levels.
Metric results can be numeric (for example, cost or duration) or percentages (for example, percentage of total project duration). Percentages are useful for portraying results within a given context.
Acumen uses metric libraries to group metrics for project analysis. Standard metric libraries pertaining to schedule quality, cost, project performance, risk exposure, Earned Value, the DCMA 14 Point Assessment, and more are included within the tool. For example, metrics can be organized by categories, project attributes, or along a project lifecycle. Organizing the metrics differently allows you to customize your project or program analysis.
Metric Scorecards
- Overall scores (for example, project scores) are based on the number of activities within the dataset that fail one or more of the metric tests (irrespective of weighting). You can modify this method on the User Interface tab of the Deltek Acumen Options dialog box to use weighted scores based not just on the number of activities that fail a test but the total number of metrics that fail a test.
- Individual activity scores are based on the weighted results of all metrics being applied to the activity.
In order to calculate these activity scores, the relative weighting for each metric is required.
Weightings
Weightings indicate how one metric counts towards the overall score for a group of metrics.
Weightings are based on a +/- 10-point sliding scale. The higher the weighting, the more impact the metric in question has on the scorecard score. By default, metric weightings have been set to the midpoint in the weighting scale (that is, +/- 5 depending on whether a high score is a positive or negative result). Newly created metrics inherit a neutral score until you edit them.
To What do Metrics Apply?
All project data is stored in a tabular manner where each activity is represented as a row of data and each activity attribute is listed in a different column.

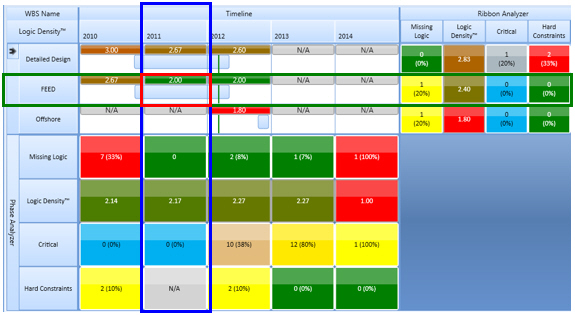
The data is then aggregated either across the spreadsheet or down the spreadsheet. When viewed in Acumen, you can use the S2 // Diagnostics tab to conduct the analysis for ribbons, phases, or intersection points.
- Across a ribbon
- Down a phase
- For the intersection of a phase/ribbon (red square)
The screenshot below shows an example view of Ribbon and Phase Analysis in Deltek Acumen on the S2 // Diagnostics tab.

A summary table of the analyses is shown below.
| Analysis Type | Summary |
|---|---|
| Ribbon Analysis | Analyze and compare groups of activities (that is, activities grouped by WBS, contractor, or CAM). |
| Phase Analysis | Analyze project time phases or identify trends. |
| Intersection Analysis | Analyze a group of activities in a certain time-phase (that is, pinpointing project hot spots). |
Metric Library
Acumen ships with a default (built-in) metric library. You can view the default library location or select a custom metric library on the General tab of the Deltek Acumen Options dialog box.
